← All work
Product Designer · 10 weeks · Web app
Northline
Product analytics teams can actually act on
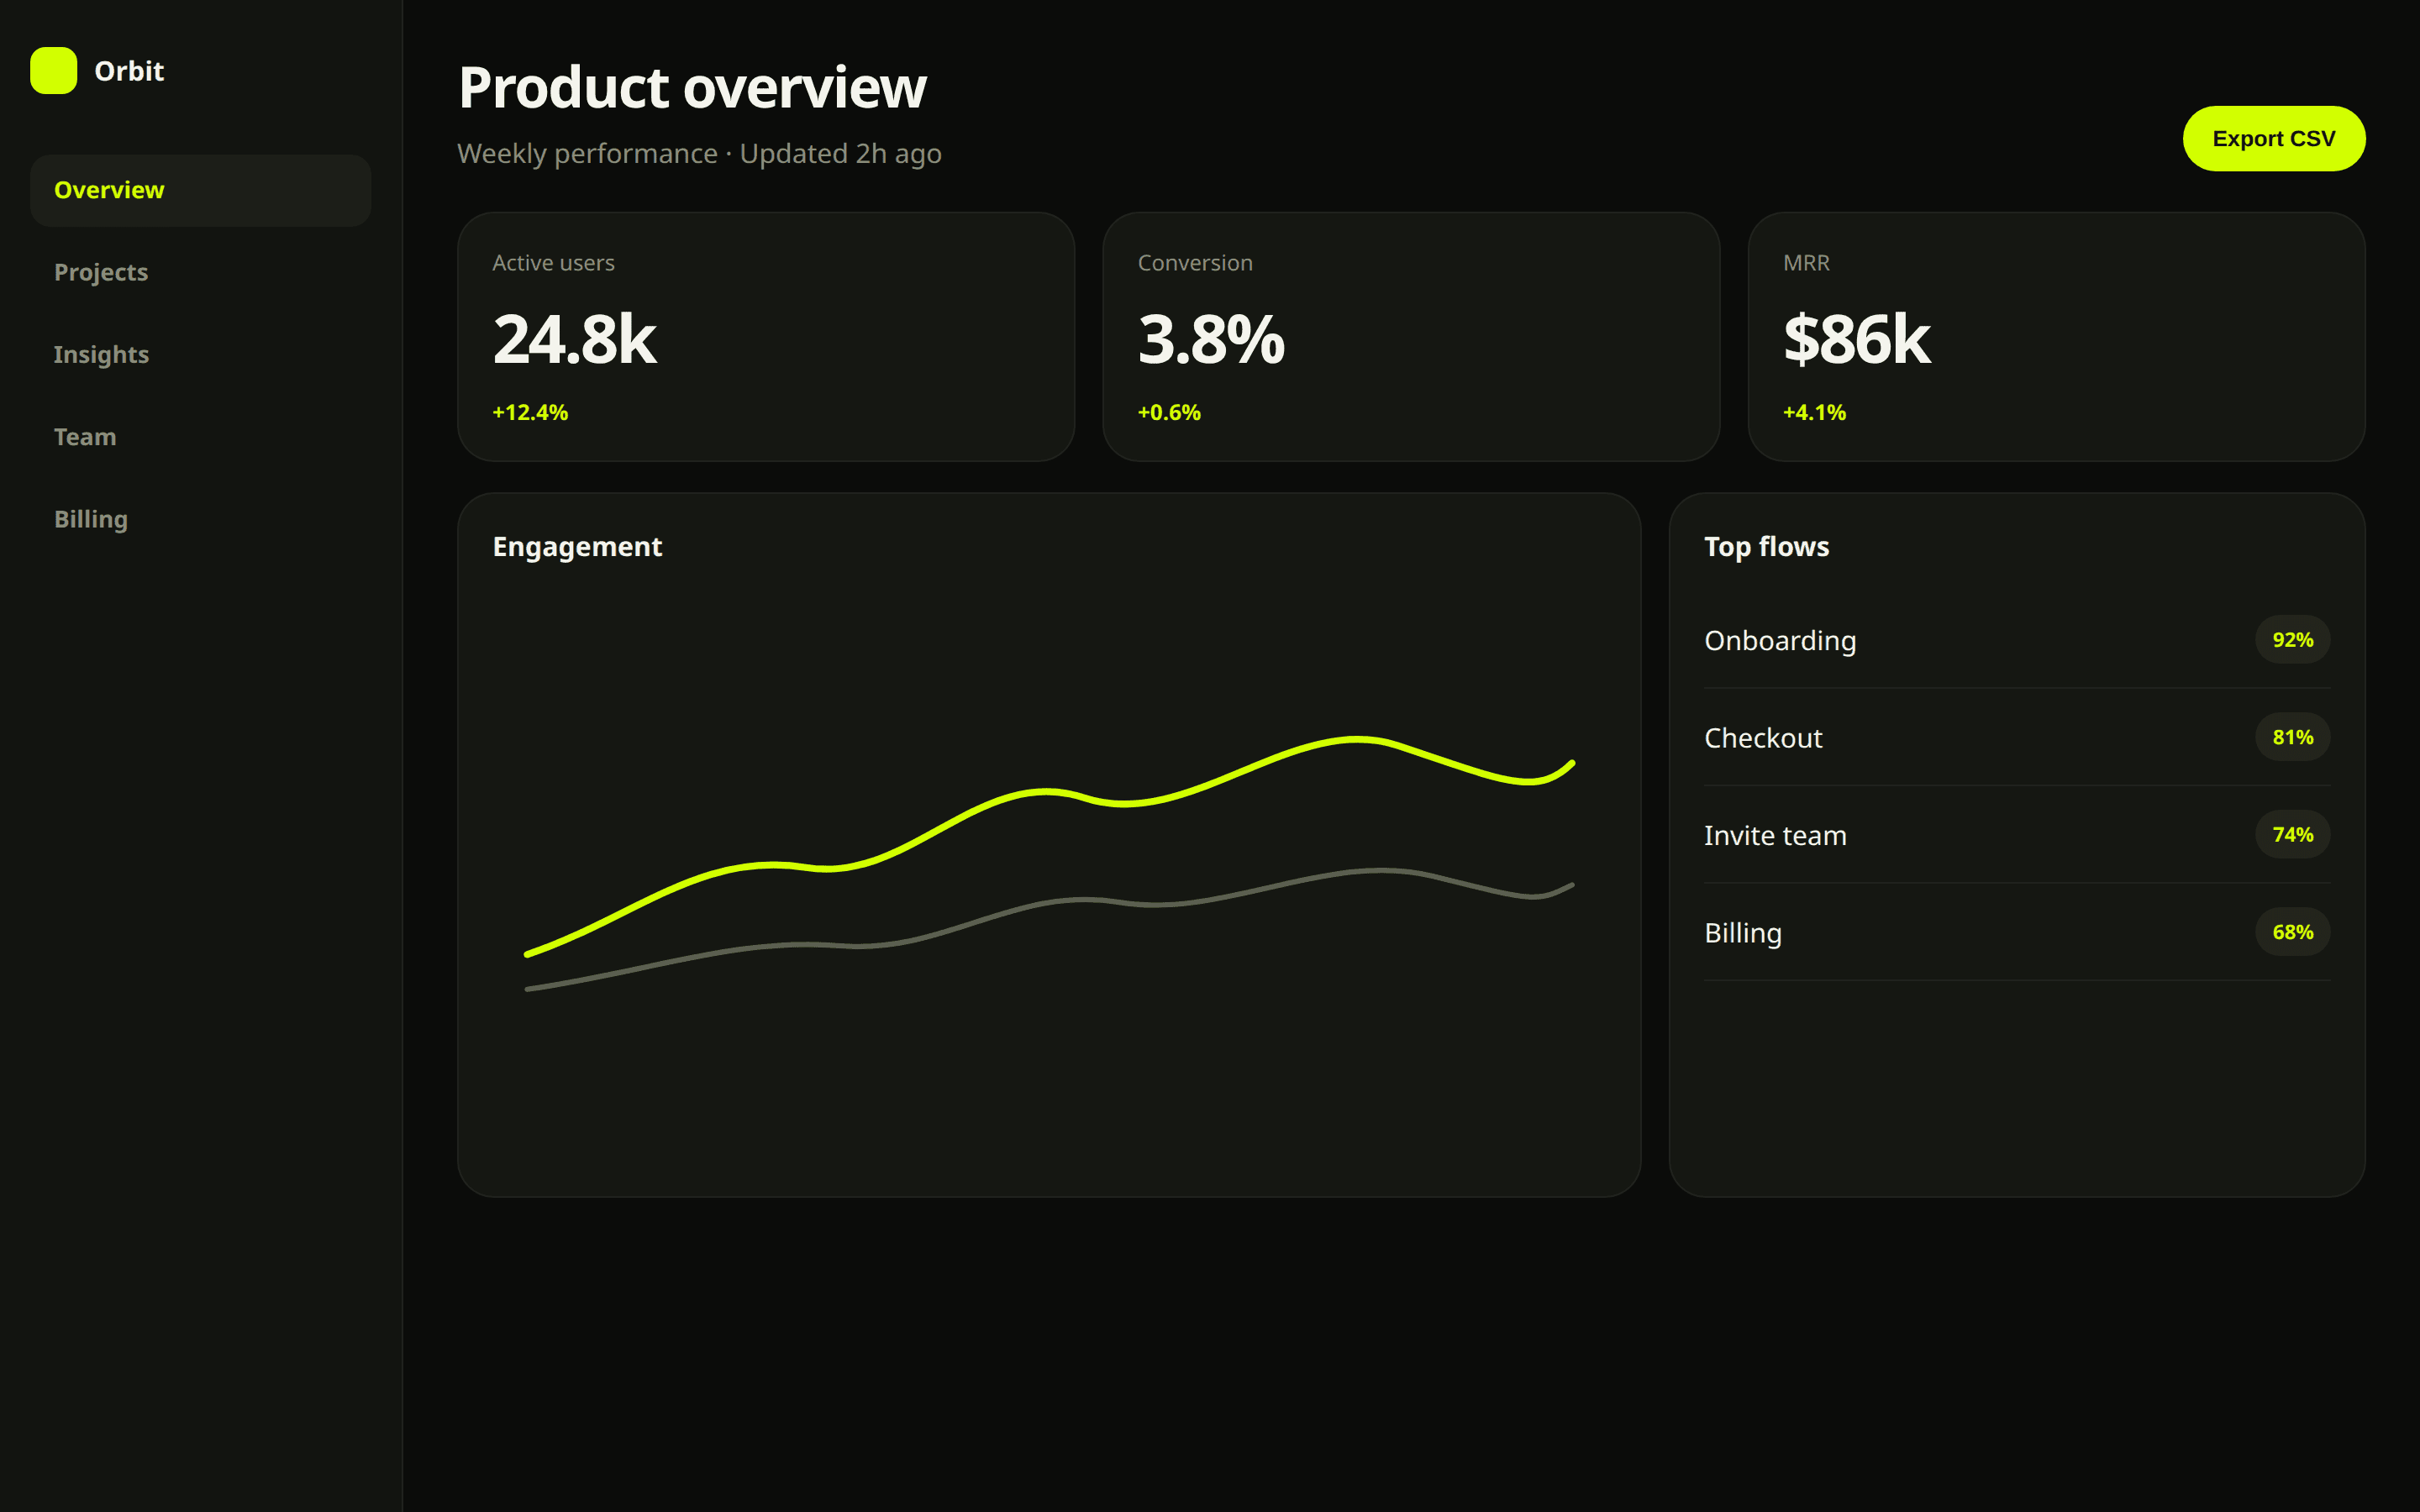
A product analytics console focused on actionable insights: denser data without drowning operators in chrome.
Client
B2B SaaS (placeholder)
Year
2025
Role
Product Designer
Platform
Web app
app.product.com
app.product.com
Problem
PMs and analysts struggled to connect charts to next actions. Dashboards looked busy but answered few questions.
Research
- Shadowed weekly growth rituals to see which metrics actually drove decisions.
- Card-sorted report types with five internal operators.
- Identified “what changed and why” as the unmet job-to-be-done.
Process
- Defined a hierarchy: KPI strip → insight callouts → deep tables.
- Systemized spacing, type, and chart chrome for a reusable SaaS kit.
- Prototyped filter persistence and saved views for repeat rituals.
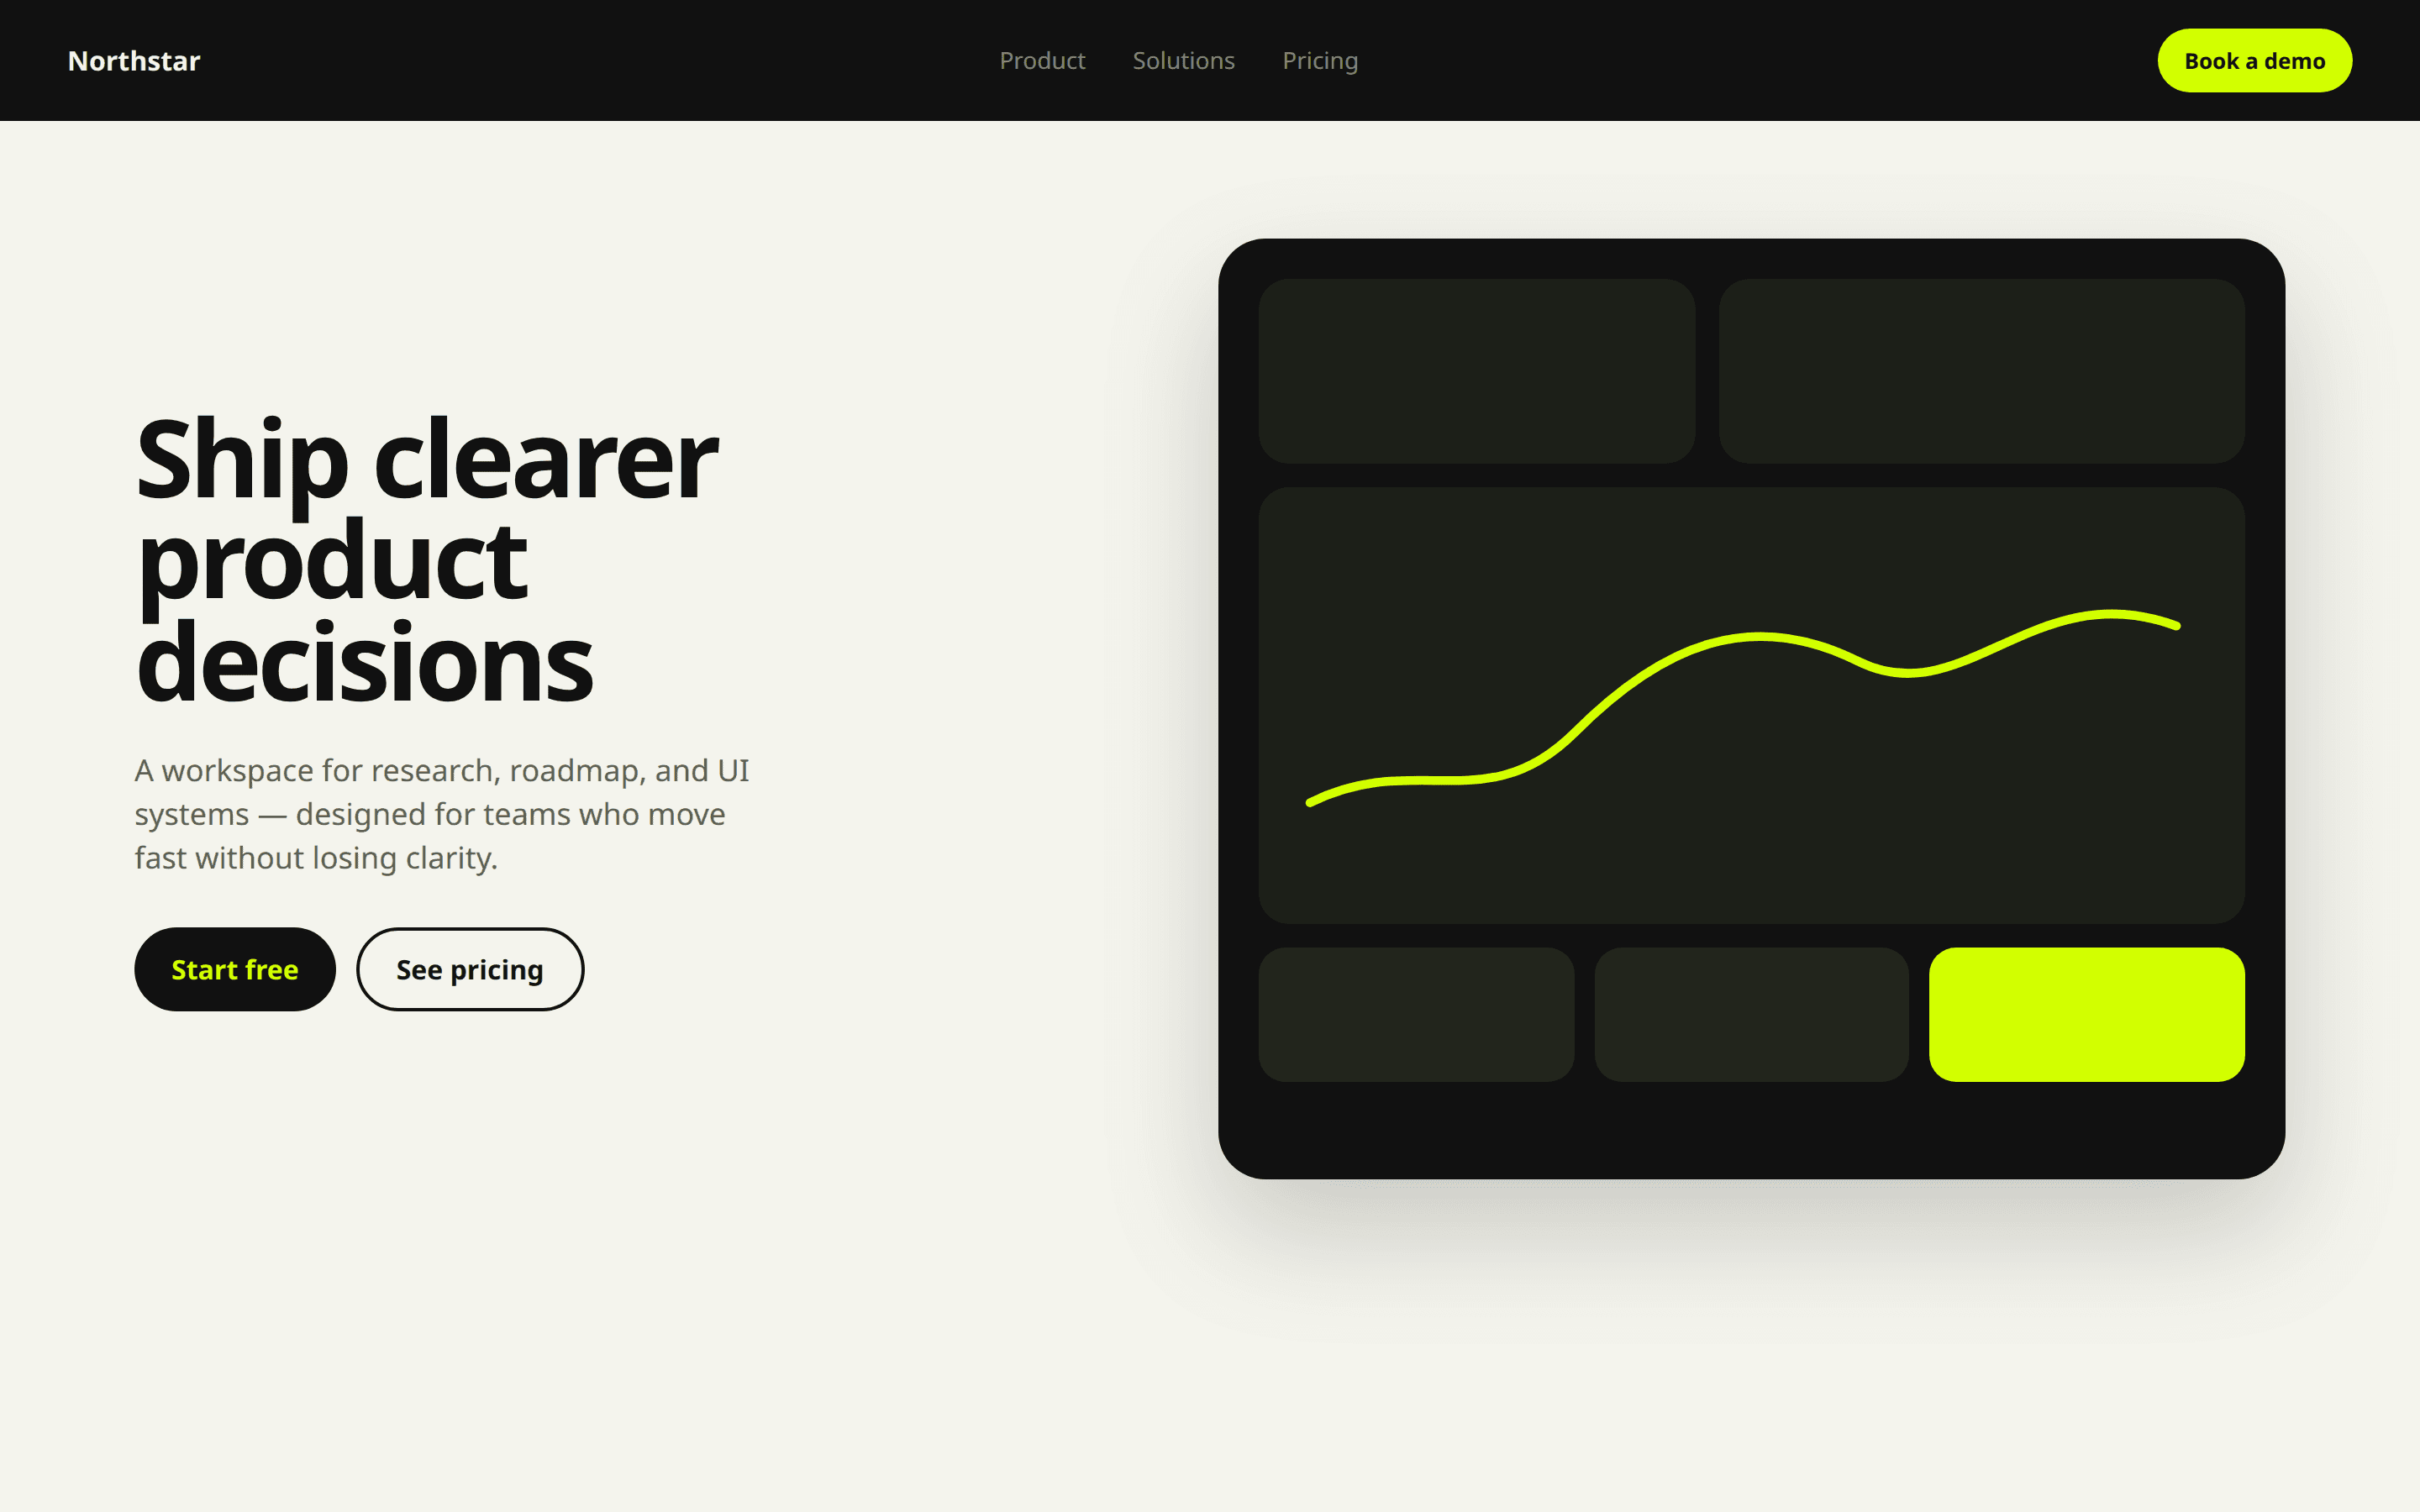
- Paired marketing preview with in-product truth for sales demos.
Solution
- Overview that surfaces change before raw volume.
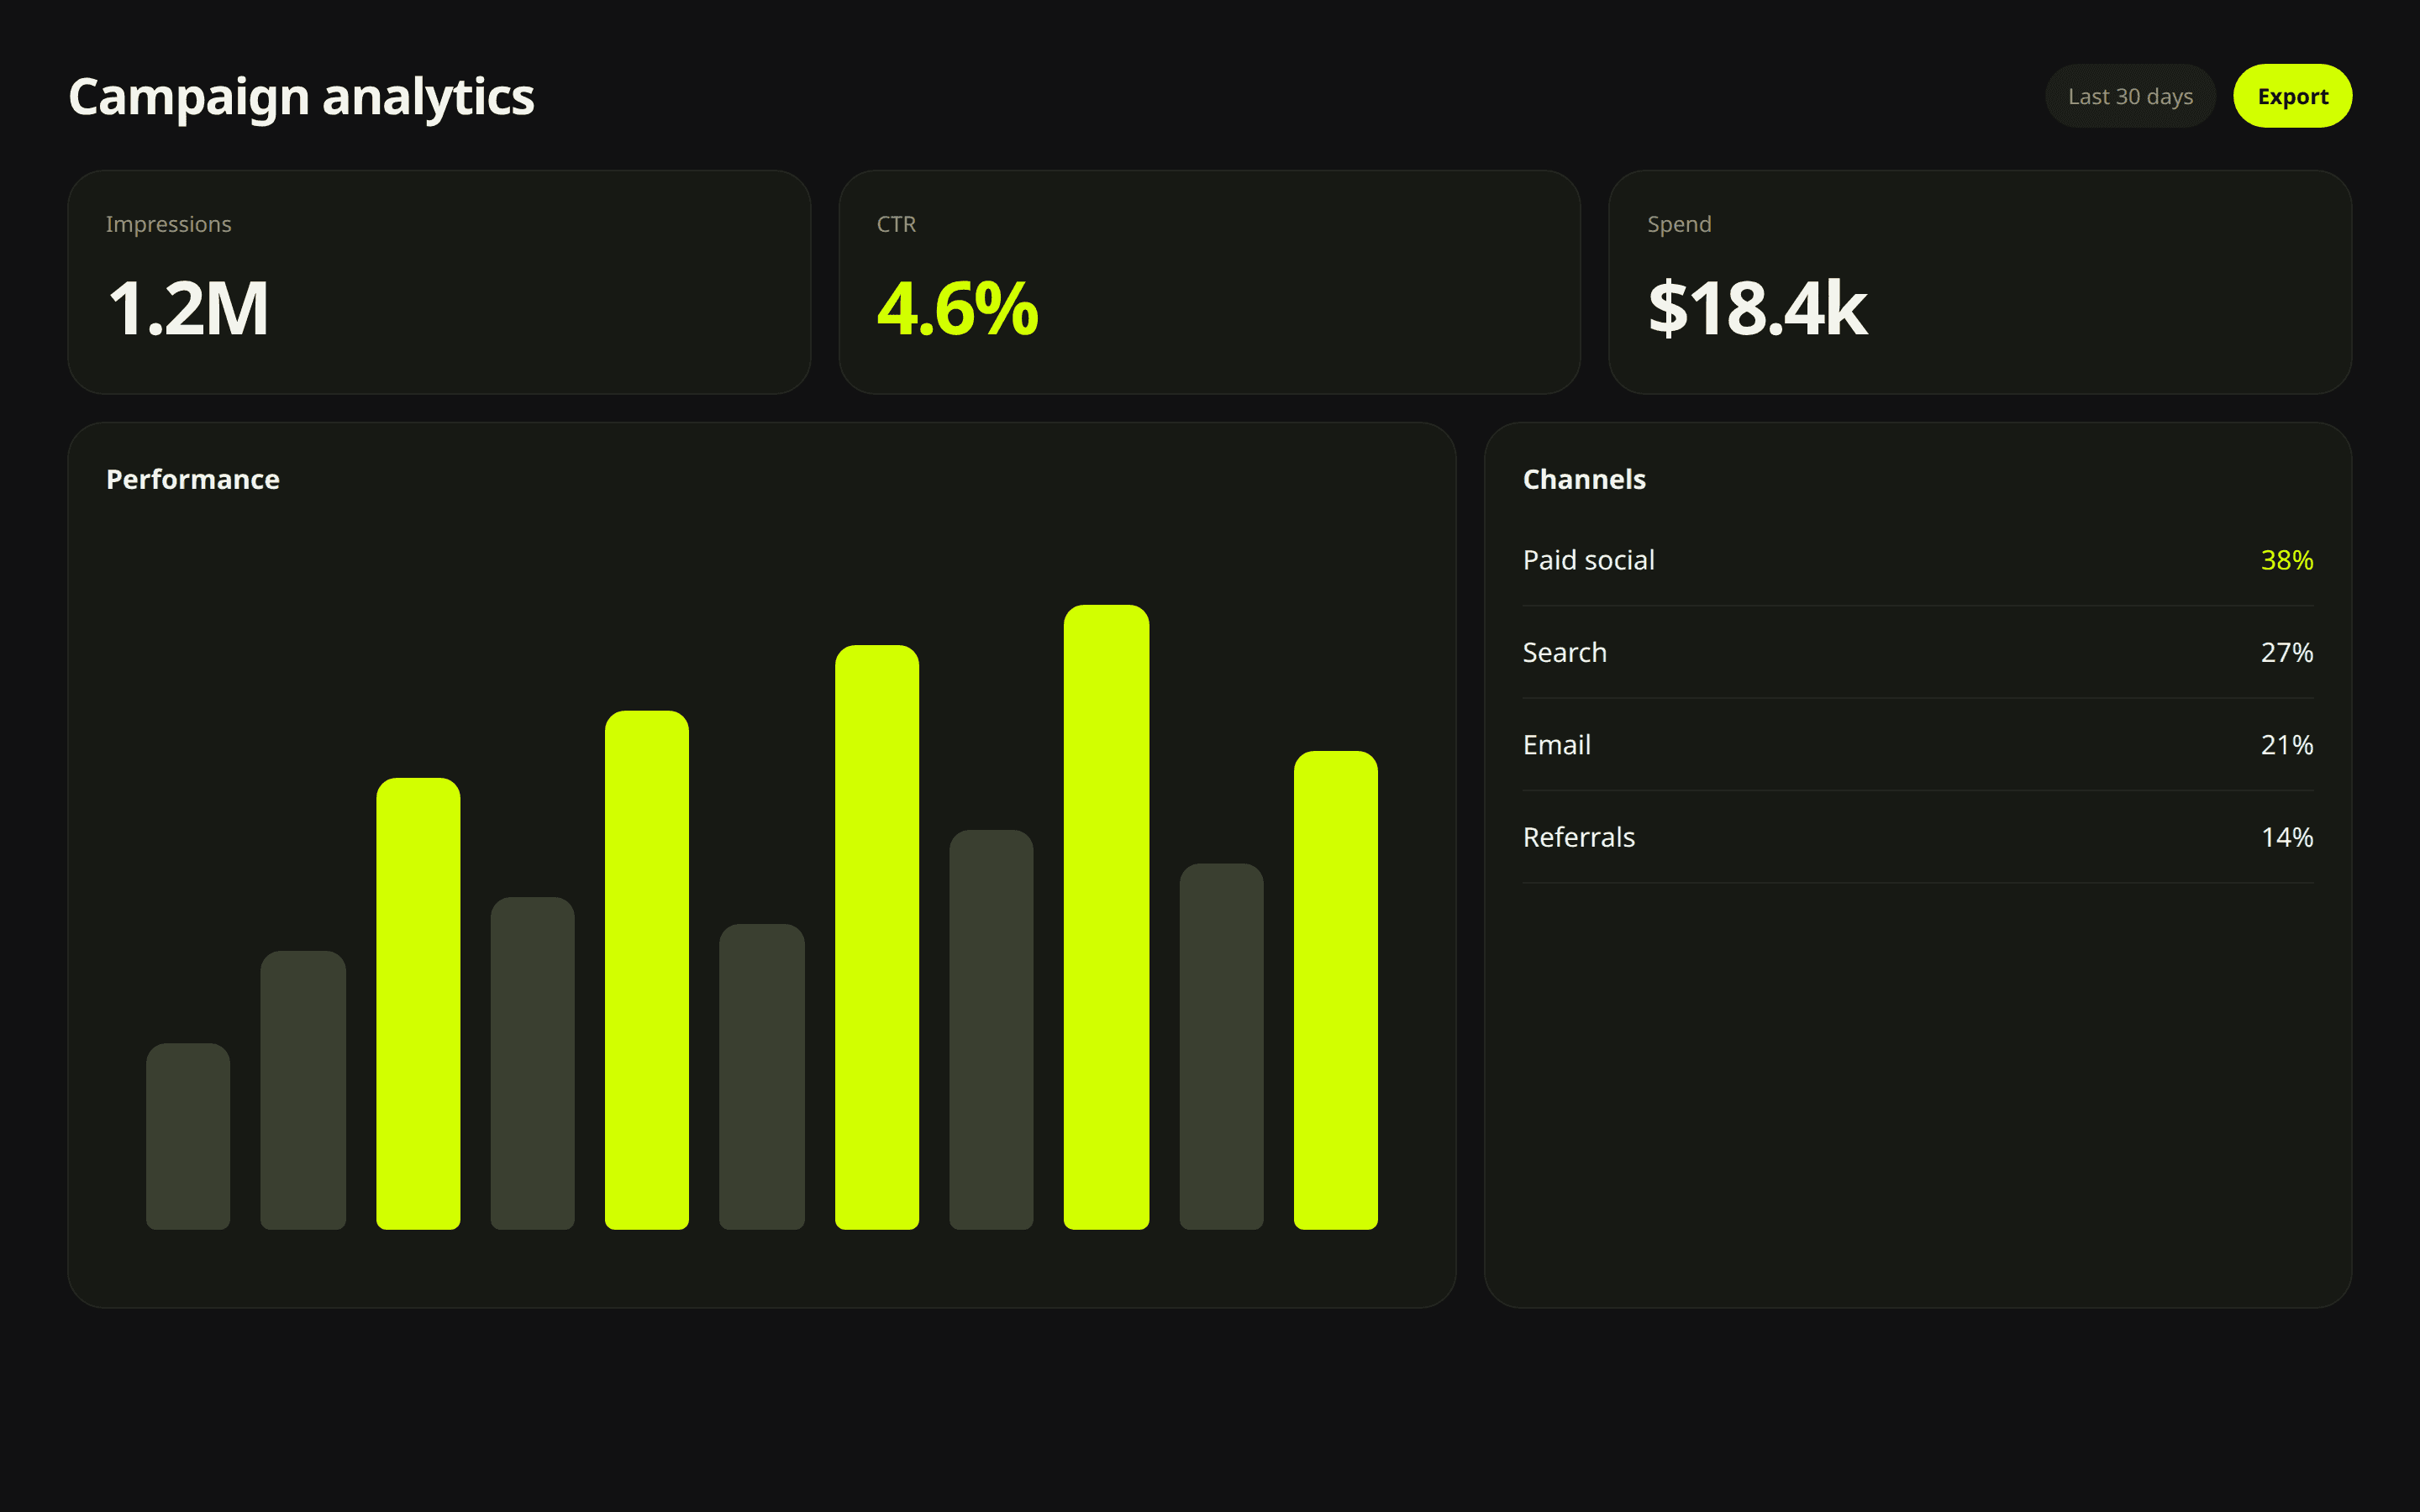
- Analytics views with clear comparison ranges.
- A compact system ready for engineering expansion.
Final UI
app.product.com
app.product.com
app.product.com
Results & impact
-28%
Time to insight
71%
Saved views adopted
42
Components shipped
Learnings
- Insight callouts beat decorative sparklines for busy operators.
- Design systems land faster when built from real dashboard density.
Tools
FigmaFramerDesign systemsPrototyping